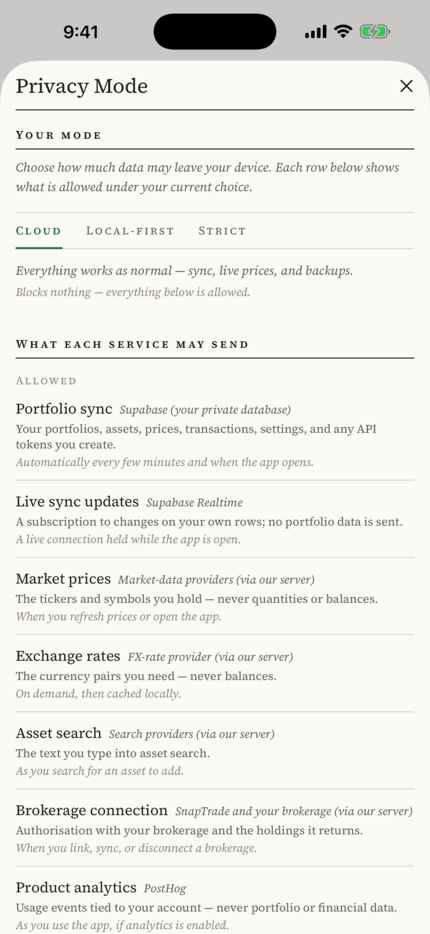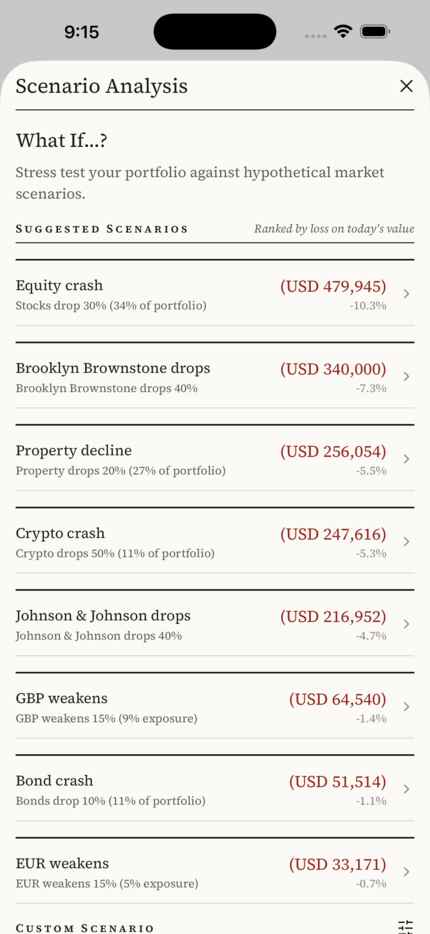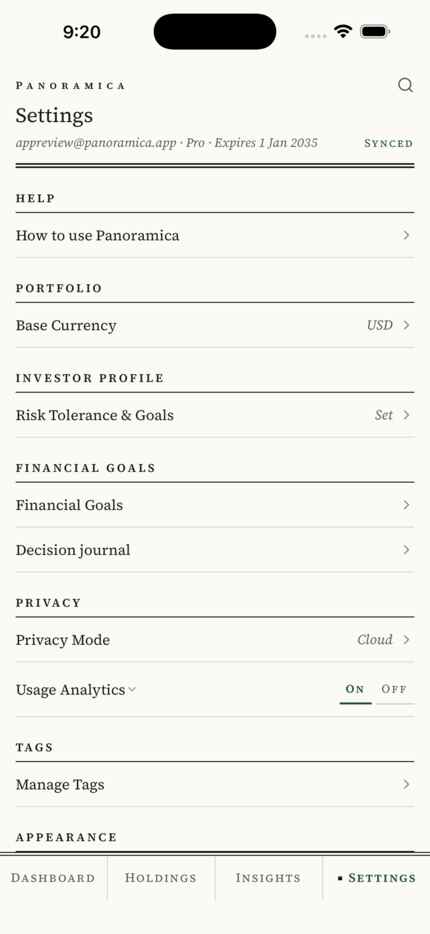
A brownstone and 1,500 NVIDIA shares, on the same statement.

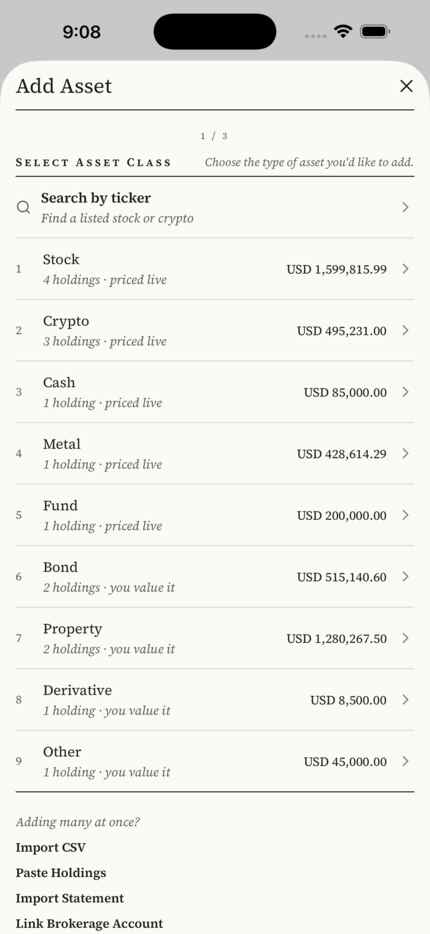
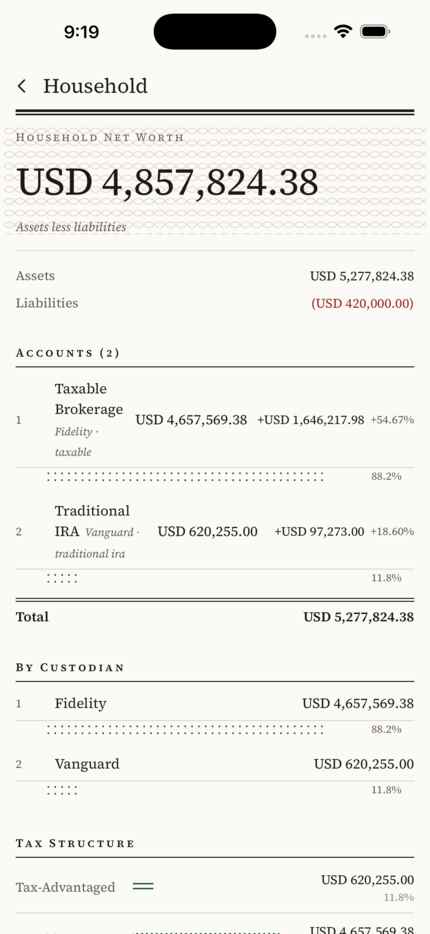
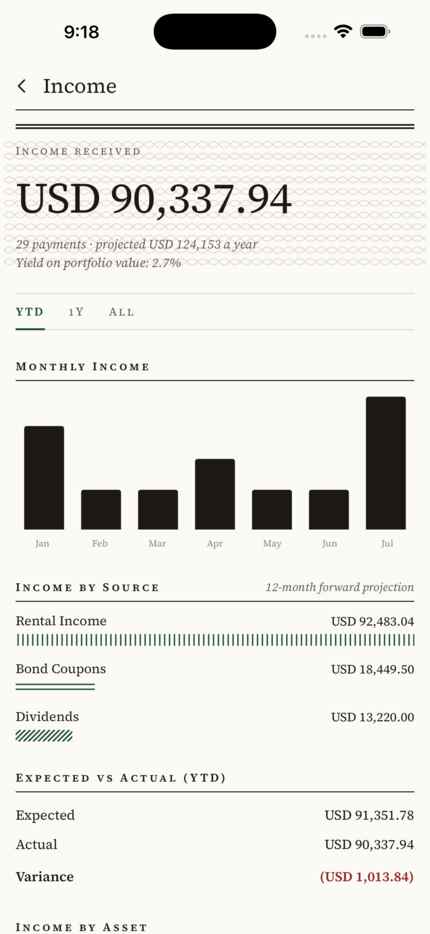
Most trackers treat anything that is not a share as a name and a number. Panoramica keeps a house with its address and the date you last valued it, gold by weight, a bond by coupon and maturity, and reports the whole portfolio in the currency you choose.

Join the waitlist

Free for 5 holdings. Pro is USD 99.99 a year.

Panoramica

Statement of Position

As at 26 September 2026

Sample portfolio · 16 holdings · reported in USD


Total value of portfolio

USD4,657,569.38

Movement on cost, to date +USD 1,670,425.07 +55.92%

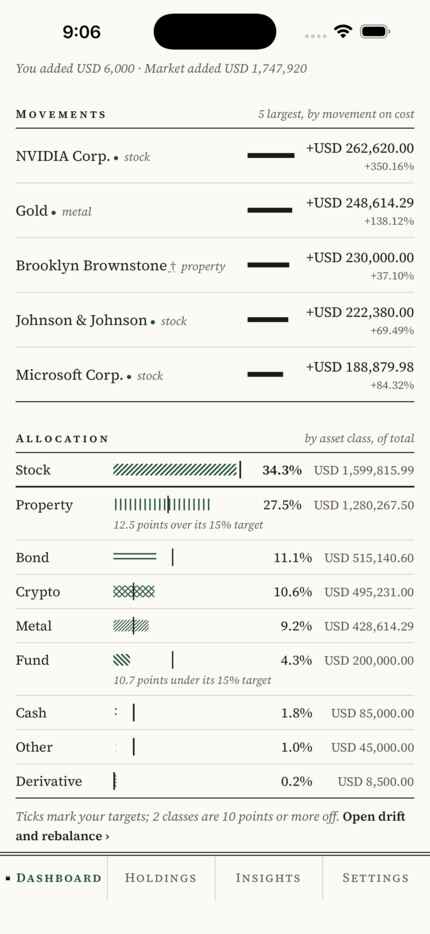
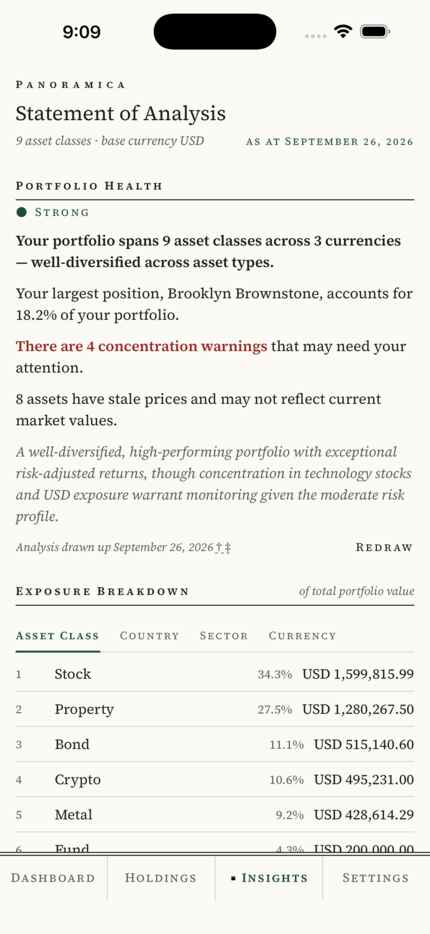
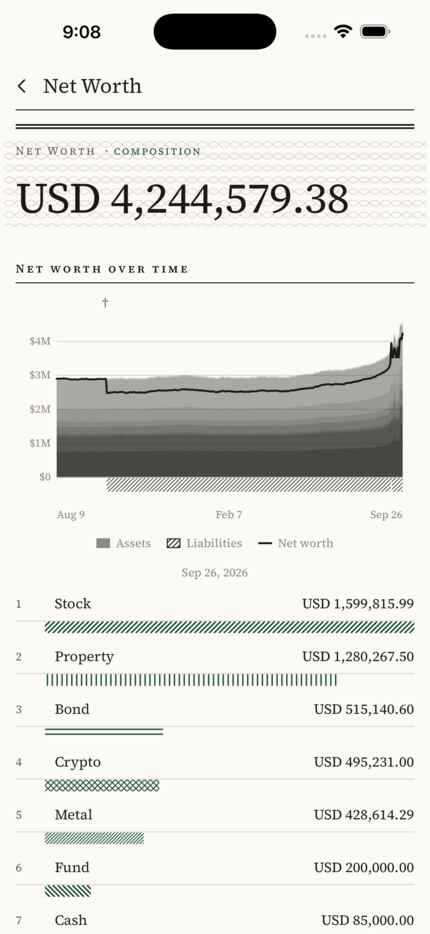
Allocationby asset class, of total
Stock34.3%
Property27.5%
Bond11.1%
Crypto10.6%
Metal9.2%
Fund4.3%
Cash1.8%
Other1.0%
Derivative0.2%
A sample portfolio, as the app reported it on 26 September 2026. Every figure on this page is read from its screens.

Schedule of Holdings

As at 26 September 2026

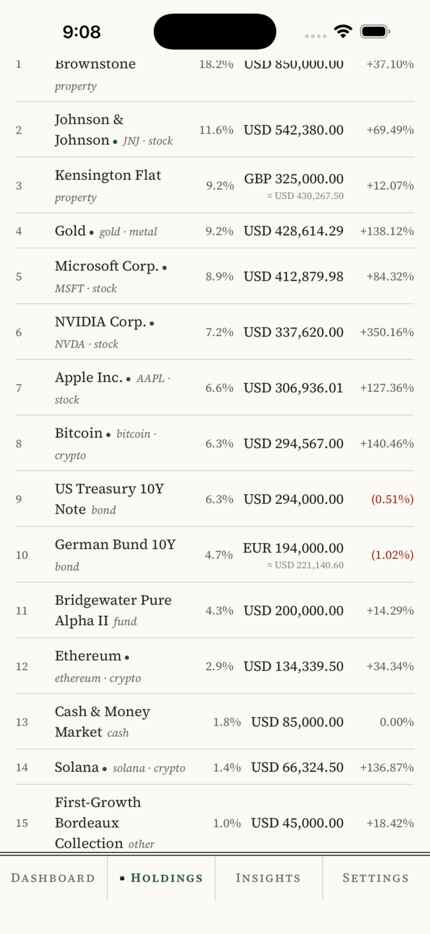
16 holdings in nine classes, largest first. Values in each holding's own currency, dollars unless marked.

№HoldingValue
1Brooklyn Brownstone†property+37.10% · 18.2% of total850,000.00
2Johnson & JohnsonJNJ · stock+69.49% · 11.6% of total542,380.00
3Kensington Flat‡property+12.07% · 9.2% of totalGBP 325,000.00
4Goldmetal+138.12% · 9.2% of total428,614.29
5Microsoft Corp.MSFT · stock+84.32% · 8.9% of total412,879.98
6NVIDIA Corp.NVDA · stock+350.16% · 7.2% of total337,620.00
7Apple Inc.AAPL · stock+127.36% · 6.6% of total306,936.01
8BitcoinBTC · crypto+140.46% · 6.3% of total294,567.00
9US Treasury 10Y§bond(0.51%) · 6.3% of total294,000.00
10German Bund 10Ybond(1.02%) · 4.7% of totalEUR 194,000.00
11Bridgewater Pure Alpha II‖fund+14.29% · 4.3% of total200,000.00
12EthereumETH · crypto+34.34% · 2.9% of total134,339.50
13Cash & Money Market#cash0.00% · 1.8% of total85,000.00
14SolanaSOL · crypto+136.87% · 1.4% of total66,324.50
15First-Growth Bordeaux††other+18.42% · 1.0% of total45,000.00
16SPY $580 Call 2026-09-18SPY · derivative+41.67% · 0.2% of total8,500.00
Total, reported in USD4,657,569.38
  1. †Brooklyn Brownstone. Owner estimate, 106 days since last valuation, past its 90-day staleness threshold.
  2. ‡Kensington Flat. Owner estimate, 121 days since last valuation, past its 90-day staleness threshold.
  3. §US Treasury 10Y. Owner estimate, 64 days since last valuation, past its 30-day staleness threshold.
  4. German Bund 10Y. Owner estimate, 68 days since last valuation, past its 30-day staleness threshold.
  5. ‖Bridgewater Pure Alpha II. Owner estimate, 91 days since last valuation, past its 7-day staleness threshold.
  6. #Cash & Money Market. Owner estimate, 62 days since last valuation, past its 1-day staleness threshold.
  7. ††First-Growth Bordeaux. Owner estimate, 151 days since last valuation, past its 30-day staleness threshold.
  8. Every other holding is priced from a market feed. The Kensington flat and the Bund are shown in their own currency and converted to dollars at the day's rate for their weight and the total.

Six of them, opened up

Tap a row in the app and it opens like this. Each kind of asset keeps the facts that matter for it.

Engraving of a four-storey brownstone with a high stoop

№ 1

Brooklyn Brownstone

A house in New York, bought in 2021. The USD 420,000 mortgage on it, at 5.75%, is carried as a liability against net worth.

Cost
USD 620,000
Present value
USD 850,000
Change on cost
+37.10%
Share of portfolio
18.2%

Valued by you. Stale after 90 days.

A property keeps what you paid, what you think it is worth, the day you said so, and the debt against it. This house is 18.2% of the portfolio; property as a whole is 27.5%.

Engraved share-certificate vignette of a seated figure of Industry

№ 2

Johnson & Johnson

Ordinary shares on the New York Stock Exchange, priced at the last close.

Cost
USD 320,000
Present value
USD 542,380
Change on cost
+69.49%
Share of portfolio
11.6%

Market price. Stale after 1 day.

Every tracker can hold this one. It is here as the yardstick: the house, the gold and the bonds around it are held to the same columns.

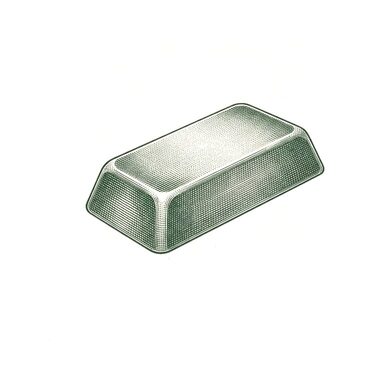
Engraving of a cast gold bar

№ 4

Gold

One hundred ounces of bullion, recorded by weight and priced at spot.

Cost
USD 180,000
Present value
USD 428,614.29
Change on cost
+138.12%
Share of portfolio
9.2%

Spot price. Stale after 1 day.

You enter the ounces once. The value follows the metal price from then on, and there is no figure to retype.

Engraving of a white stucco London terraced house

№ 3

Kensington Flat

A flat in London, held in pounds and reported in dollars at the day's exchange rate.

Present value
GBP 325,000
Change on cost
+12.07%
Reported in
USD
Currencies on offer
37

Valued by you. Stale after 90 days.

A foreign holding's gain comes in two parts: what the asset earned, and what the exchange rate added or took away. The app reports them separately.

Engraving of a computer processor chip

№ 6

NVIDIA Corp.

1,500 shares on NASDAQ, bought on 20 June 2024 at USD 50.00 each.

Cost
USD 75,000
Present value
USD 337,620
Change on cost
+350.16%
Cost basis rule
FIFO

Last close. Stale after 1 day.

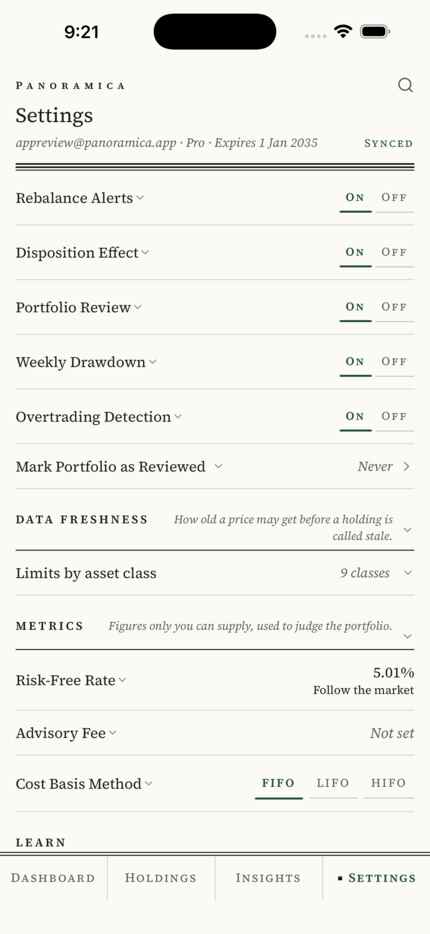
Cost basis is worked out from the trades. First in, first out is the default; last in, first out and highest cost first are one setting away, and the rule you choose changes the taxable gain.

Engraving of a bond certificate with its interest coupons

№ 9

US Treasury 10Y

A ten-year US government note. One of two holdings on this statement that are down.

Cost
USD 295,500
Present value
USD 294,000
Change on cost
(0.51%)
Share of portfolio
6.3%

Valued by you. Stale after 30 days.

A bond gets thirty days before its price counts as stale, where a share gets one. Bond prices move slowly and are quoted less often, so the app waits longer before asking you to update one.

Join the waitlist

Hold your own this way. Free for 5 holdings.

What else it does

Point at a row to see its screen, taken from the same sample portfolio.

What it holds

How a price arrives

What it measures

What it tells you

Habits it points out

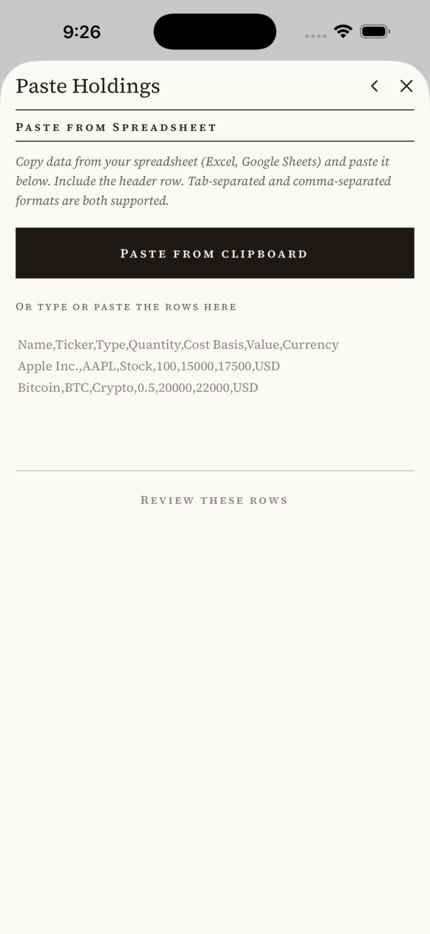
How holdings get in

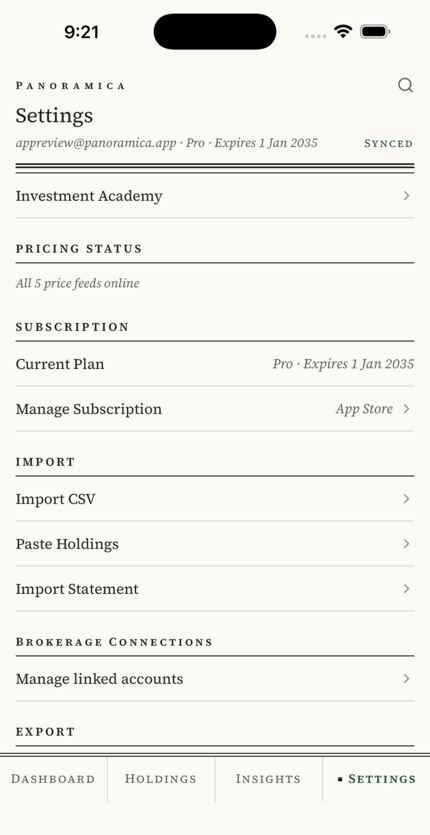
Where it keeps them

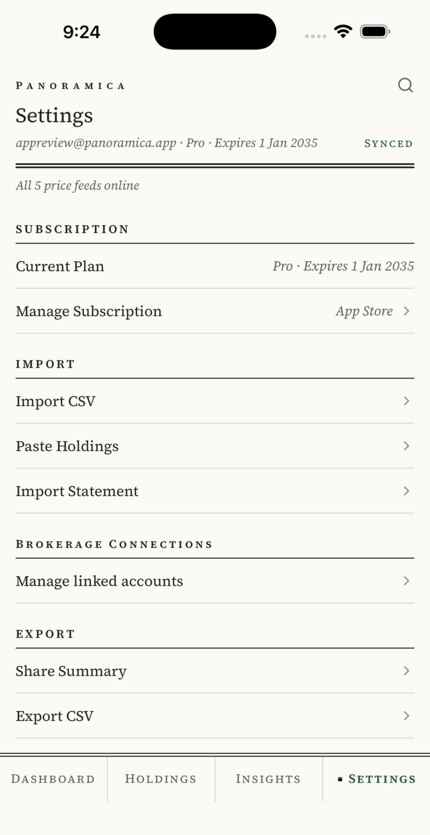
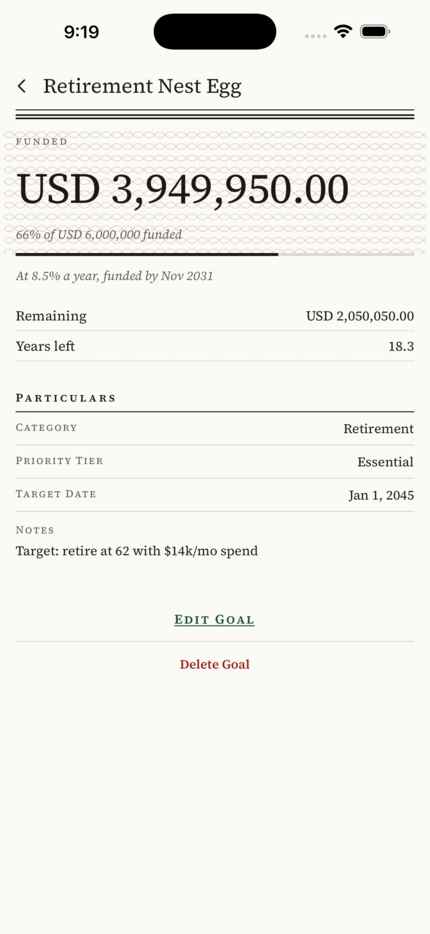
Rows marked Pro need a subscription. The rest come with the free plan. See the prices.

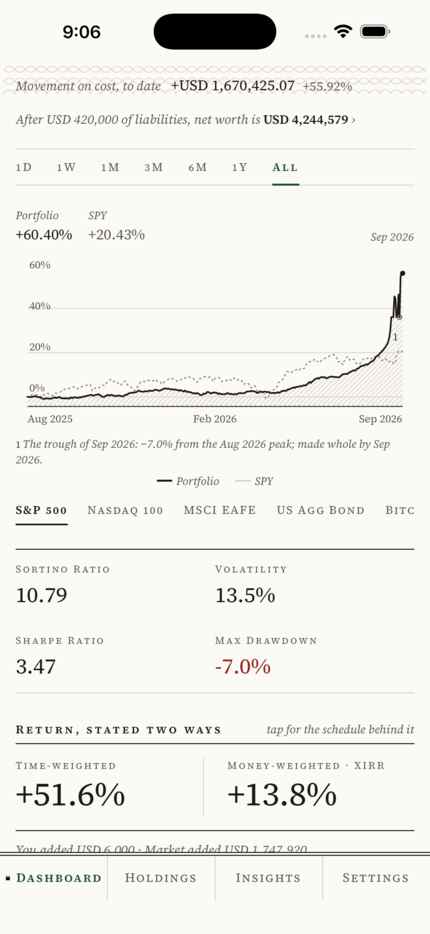
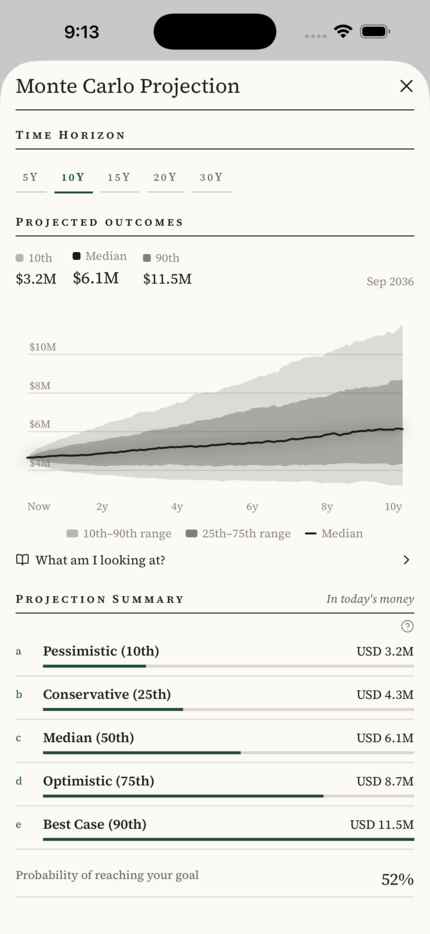
The dashboard: movement on cost and net worth, the portfolio's line drawn against the S&P 500, four risk metrics, and return stated both time-weighted and money-weighted.
The dashboardHow the holdings performed, with the timing of your deposits taken out. This portfolio: +51.6%. Included in the free plan.

Free

USD 0

with no time limit

  • 5 holdings in 1 portfolio
  • Live prices and exchange rates
  • Both measures of return
  • CSV import and export
  • Works offline

Pro

USD 99.99

a year, or 12.99 a month

  • Unlimited holdings and portfolios
  • Everything marked Pro above
  • A review against your own limits, with the trades to get back
  • PDF reports and price alerts

For comparison, a 1% advisory fee on the sample portfolio would be USD 46,576 a year.

What it does not do

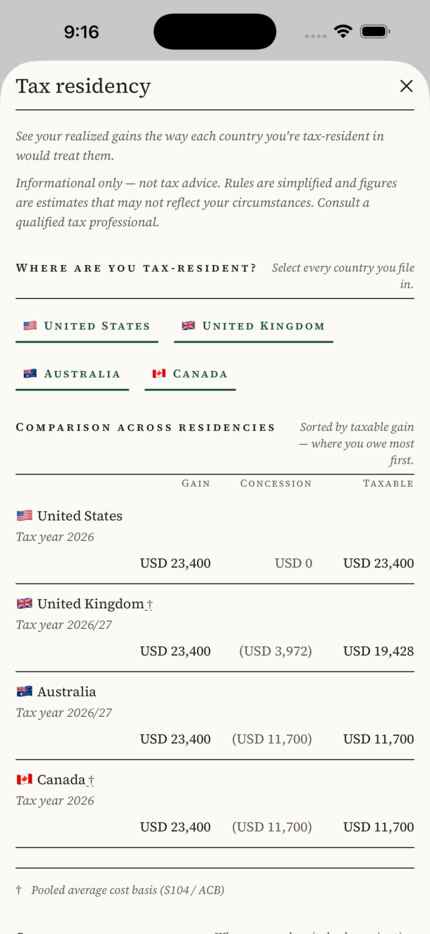
It works out taxable gains for the US, the UK, Australia and Canada. It holds no tax-rate tables, files nothing, and will not tell you what you owe.

It runs on iPhone and iPad. There is no Android version.

It gives no advice. Its analysis describes your portfolio and leaves the decisions to you.

Join the waitlist

Panoramica is finished and running; the App Store listing is not up yet. Leave your address and you get one email, on the day it is.